

NAFA member, Tony Kioussis, President of Asset Insight, breaks down the basic elements in understanding market dynamics using objective data points.
Each day, countless organizations collect and disseminate vast amounts of data points relating to business aviation. The challenge has always been translating such data into useful, actionable and timely information. While computers can process immeasurable statistics at the speed of light, their analytical capability must be intelligently guided to generate useful conclusions, as opposed to new data points that further complicate, rather than answer, the original questions. And, perhaps even more important, computers are dispassionate workhorses that can objectively convert massive amounts of data into useful information.
Asset Quality Rating
When it comes to aircraft, one of the most basic objective analytics able to act as a planning and decision-making tool is the Asset Quality Rating – a standardized scale by which one can measure the maintenance condition of any asset.
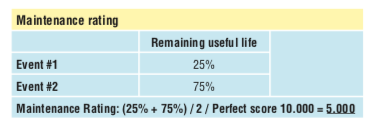
Asset Quality Rating is comprised of 2 data points. The first one is the aircraft’s Maintenance Rating, which grades an asset’s maintenance status on a standardized scale relative to its Optimal Maintenance Condition (maintenance condition on the day it came off the production line). In very simplistic terms, the figure is computed as follows for a theoretical asset that has only 2 maintenance events:
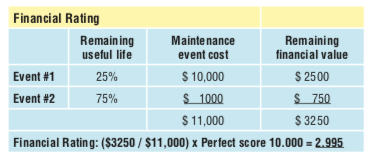
The 2nd data point is the aircraft’s Financial Rating, which grades the asset’s financial condition on a standardized scale relative to its Optimal Maintenance Condition, meaning the aircraft’s Maintenance Rating is weighted by the estimated cost to complete each maintenance event. While the Maintenance Rating for this asset is 5.000 (see above), the asset’s Financial Rating is 2.955 by virtue of its proximity to future scheduled maintenance events (Remaining Useful Life) and the anticipated cost to complete each maintenance event (Maintenance Event Cost).
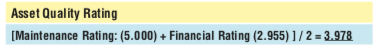
Averaging the Maintenance Rating and Financial Rating figures derives the aircraft’s Asset Quality Rating:
To simplify the Asset Quality Rating explanation we assumed the asset had only 2 maintenance events. In reality, an aircraft may have hundreds of maintenance events. Also, each aircraft must be continually compared against its own Optimal Maintenance Condition.
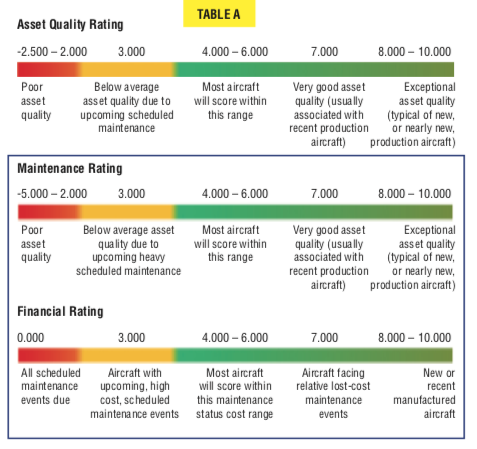
Using this methodology, Asset Quality Rating permits us to establish a measurement standard that can be applied to all aircraft and allows us to compare different make/model assets directly on the same measurement scale (see Pro Pilot, Aug 2018, p 14). The Asset Quality Rating scale ranges from a low of -2.500 to a high of10.000, and the significance of the figures are detailed on Table A.
The Maintenance Rating scale ranges from a -5.000 to a 10.000, while the Financial Rating scale ranges from 0.000 to 10.000. There are 2 reasons for this: 1, an operator lying on Part 91 can overrun the OEM’s “recommended” maintenance time-period, at which point the Maintenance Rating for that event would post a negative value. And 2, the financial Rating can be no less than the cost for conducting the event, therefore its value cannot go below zero.
Maintenance Equity and Maintenance Exposure
There are 2 other objective analytics that can help an aircraft owner plan an aircraft replacement strategy that optimizes their investment in the asset: Maintenance Equity and Maintenance Exposure.
Maintenance Equity represents, in financial terms, the amount of maintenance value embedded in the asset. It defines the difference between the aircraft’s maximum scheduled maintenance financial value (achieved the day the aircraft came off the production line), LESS the maintenance financial value consumed through utilization.
Maintenance Exposure represents, in financial terms, the amount of maintenance value consumed through utilization, LESS maintenance completed on the aircraft.
There is a widely-held misconception that aircraft maintenance condition deteriorates dramatically over time. While some maintenance event costs increase as the asset ages, an aircraft’s Maintenance Equity is renewed as maintenance is conducted. Table B depicts the percent-age of Maintenance Equity retained by an aircraft during its first 5 years in operation, and the percent of Maintenance Equity available during operating years 15 through 20. The initial Maintenance Equity is available due to the aircraft’s recent production date, while scheduled maintenance completion will renew the asset’s Maintenance Equity in later years.
Read full article here.
This article was originally published in Professional Pilot April 2019.